PLEASE NOTE:
1. Data is downloaded from Yahoo Finance and quotes are 15 min. delayed approx
2. Yahoo Finance historical data is 1-2 days out of date for certain Asian Exchanges
Chart Lists and Individual Charts:
- Charts can be viewed as part of watch lists, or individually by symbol
- Create one or more watch lists. The App saves each list for future use
- Add stock symbols to each list. Trading details can optionally be entered for each symbol
- View current stock price data for each symbol in a list
- Tap a symbol in the selected List to view current stock data in chart format
- Save charts for later review while not connected to the internet
Saved Charts:
- View any chart previously saved. Viewing charts can be done while not connected to the internet
- Delete individual charts or all charts to manage storage
Features:
- Access detailed Help for each screen
- View training videos on You Tube:
- http://youtu.be/3weArYctcZQ (demo without lists)
- http://youtu.be/YEEpK1C9WGM (demo with lists)
- The App is installed with Default values for various options. The Settings Menu enables changes to options.
- Select the type of data and the date range. The type of data can be Daily, Weekly, or Monthly. The date range can vary from 3 months of Daily data to 20 years of Monthly data
- Set the chart type to Candlesticks, High-Low-Close (HLC) bars, or a Solid Line
- Parameters can be modified
- Indicators include Volume, OBV, Volume A/D, Rate of Change, Stochastics, RSI, MACD, Follow Through Day, Relative High and Low, SMA (single, double, and triple crossover), Bollinger Bands, and Price Channels
- Tap a list to view current prices for all symbols in the list. It shows the gain or loss for a position if Buy Price was entered for a symbol. Then, tap a symbol in the list to view its chart
- A symbol's trading details (if any) are also shown. Trading details may include purchase date, position (number shares), buy price, target and stop
-The profitability of Buy and Sell signals generated by indicators are tracked individually on a Trades screen and a comparison of the relative profitability of all indicators over the time frame is also calculated
Charts:
- Zoom in the right half of the chart
- Zoom out to view all data
- Define a zoom range on the chart by tapping, holding, and moving two fingers
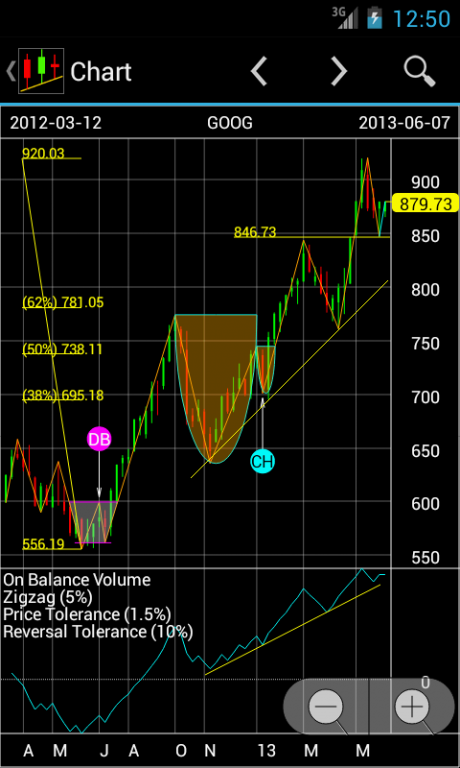
- Tap anywhere over the right price axis to see a horizontal price line on the chart
- Tap anywhere over the price bars to see a price box on the chart. The price box for a price bar shows the Date, Open, High, Low, Close and Volume
- The Chart Type (Candlestick/HLC Bars/Solid line) and the type and date range of price bars can be changed using menu settings
- ’Finger Swipe’ the Indicators section of the chart to cycle through the available indicators. Indicators can be customized using menu settings
- Add trend-lines to the chart. A trend-line can be added with one or two fingers
- Add support lines.
- Add Retracement lines.
- Send Chart in Email with a screen-shot attachment
- Save Chart for Offline for later review
- Go Back or Go Forward through the charts of symbols in a list
- Enter symbol to view its chart
Trade Charts:
- Planned for a future release.
keywords: stock, stocks, stock market, quotes, candlestick, technical analysis, chart, portfolio, trend line, support, retracement, trading, back-testing, price patterns
We do not host EE Stock Charts on our servers. We did not scan it for viruses, adware, spyware or other type of malware. This app is hosted by Google and passed their terms and conditions to be listed there. We recommend caution when installing it.
The Google Play link for EE Stock Charts is provided to you by apps112.com without any warranties, representations or guarantees of any kind, so access it at your own risk.
If you have questions regarding this particular app contact the publisher directly. For questions about the functionalities of apps112.com contact us.

|
| ||||
| Downloads: 4 | ||||
| Updated At: 2024-03-29 14:40:01 | ||||
| Publisher: Retep Civorodot | ||||
| Operating System: Android | ||||
| License Type: Free Trial |